kube-cosmos GitHub
Open source · Kubernetes visualization

See your cluster come alive.

kube-cosmos turns your Kubernetes cluster into a living, real-time 3D universe. Namespaces become galaxies, pods become stars, nodes are the suns around them – and every request flies as a comet. A new way to experience and understand Kubernetes.

● Live from your cluster Apache-2.0 Read-only mode Local LLM possible
Cluster health
⚠ 1 problem · ✓ 62 of 63 pods healthy
Sun · Node
desktop-worker · CPU 77 %
Real-timewatch API, no polling
Real trafficfrom access logs
Plain languageask, don’t grep
Time travelreplay the past 24 h
Demo

The basics in two minutes

A real cluster with real traffic: zoom into a namespace, follow requests as comets, catch a crash-looping pod, get it explained in plain words, and switch to the node view.

Health barNamespace zoomLive trafficHover cards Problem pulseAI explanationNode viewPresentation mode
How to read it

Your cluster, as a night sky

Every Kubernetes object has its own celestial body. Learn the picture once – and you can read any cluster at a glance, from far away down to a single container.

Galaxy = NamespaceA glowing bubble around everything a team or app owns.
Star = PodColor shows the state: green runs, yellow starts, red fails.
Sun = NodeThe corona flares up with the machine’s CPU load.
Diamond = DeploymentKeeps the right number of pod copies alive.
Ring = ServiceA stable address that spreads requests across pods.
Portal = IngressThe gate where outside requests enter the cluster.
Comet = RequestReal traffic, live. Errors glow red.
Satellite = Outside clientBrowsers, scripts, bots and monitoring – by user agent.
Cylinder = Volume (PVC)Fills up as the volume fills up.
Features

Beautiful. And genuinely useful.

kube-cosmos is not a screensaver. Everything you see is live cluster state – and everything you see can be explained, asked about and replayed.

Live traffic

Watch every request fly

kube-cosmos reads the access logs of your ingress and services and turns each request into a comet: from outside clients, through the ingress portal, via the service, to the pod that answers it.

  • Errors and dropped requests light up red
  • Outside clients appear as satellites – browser, script, bot or monitoring
  • No service mesh or eBPF needed: nginx and Traefik logs are enough
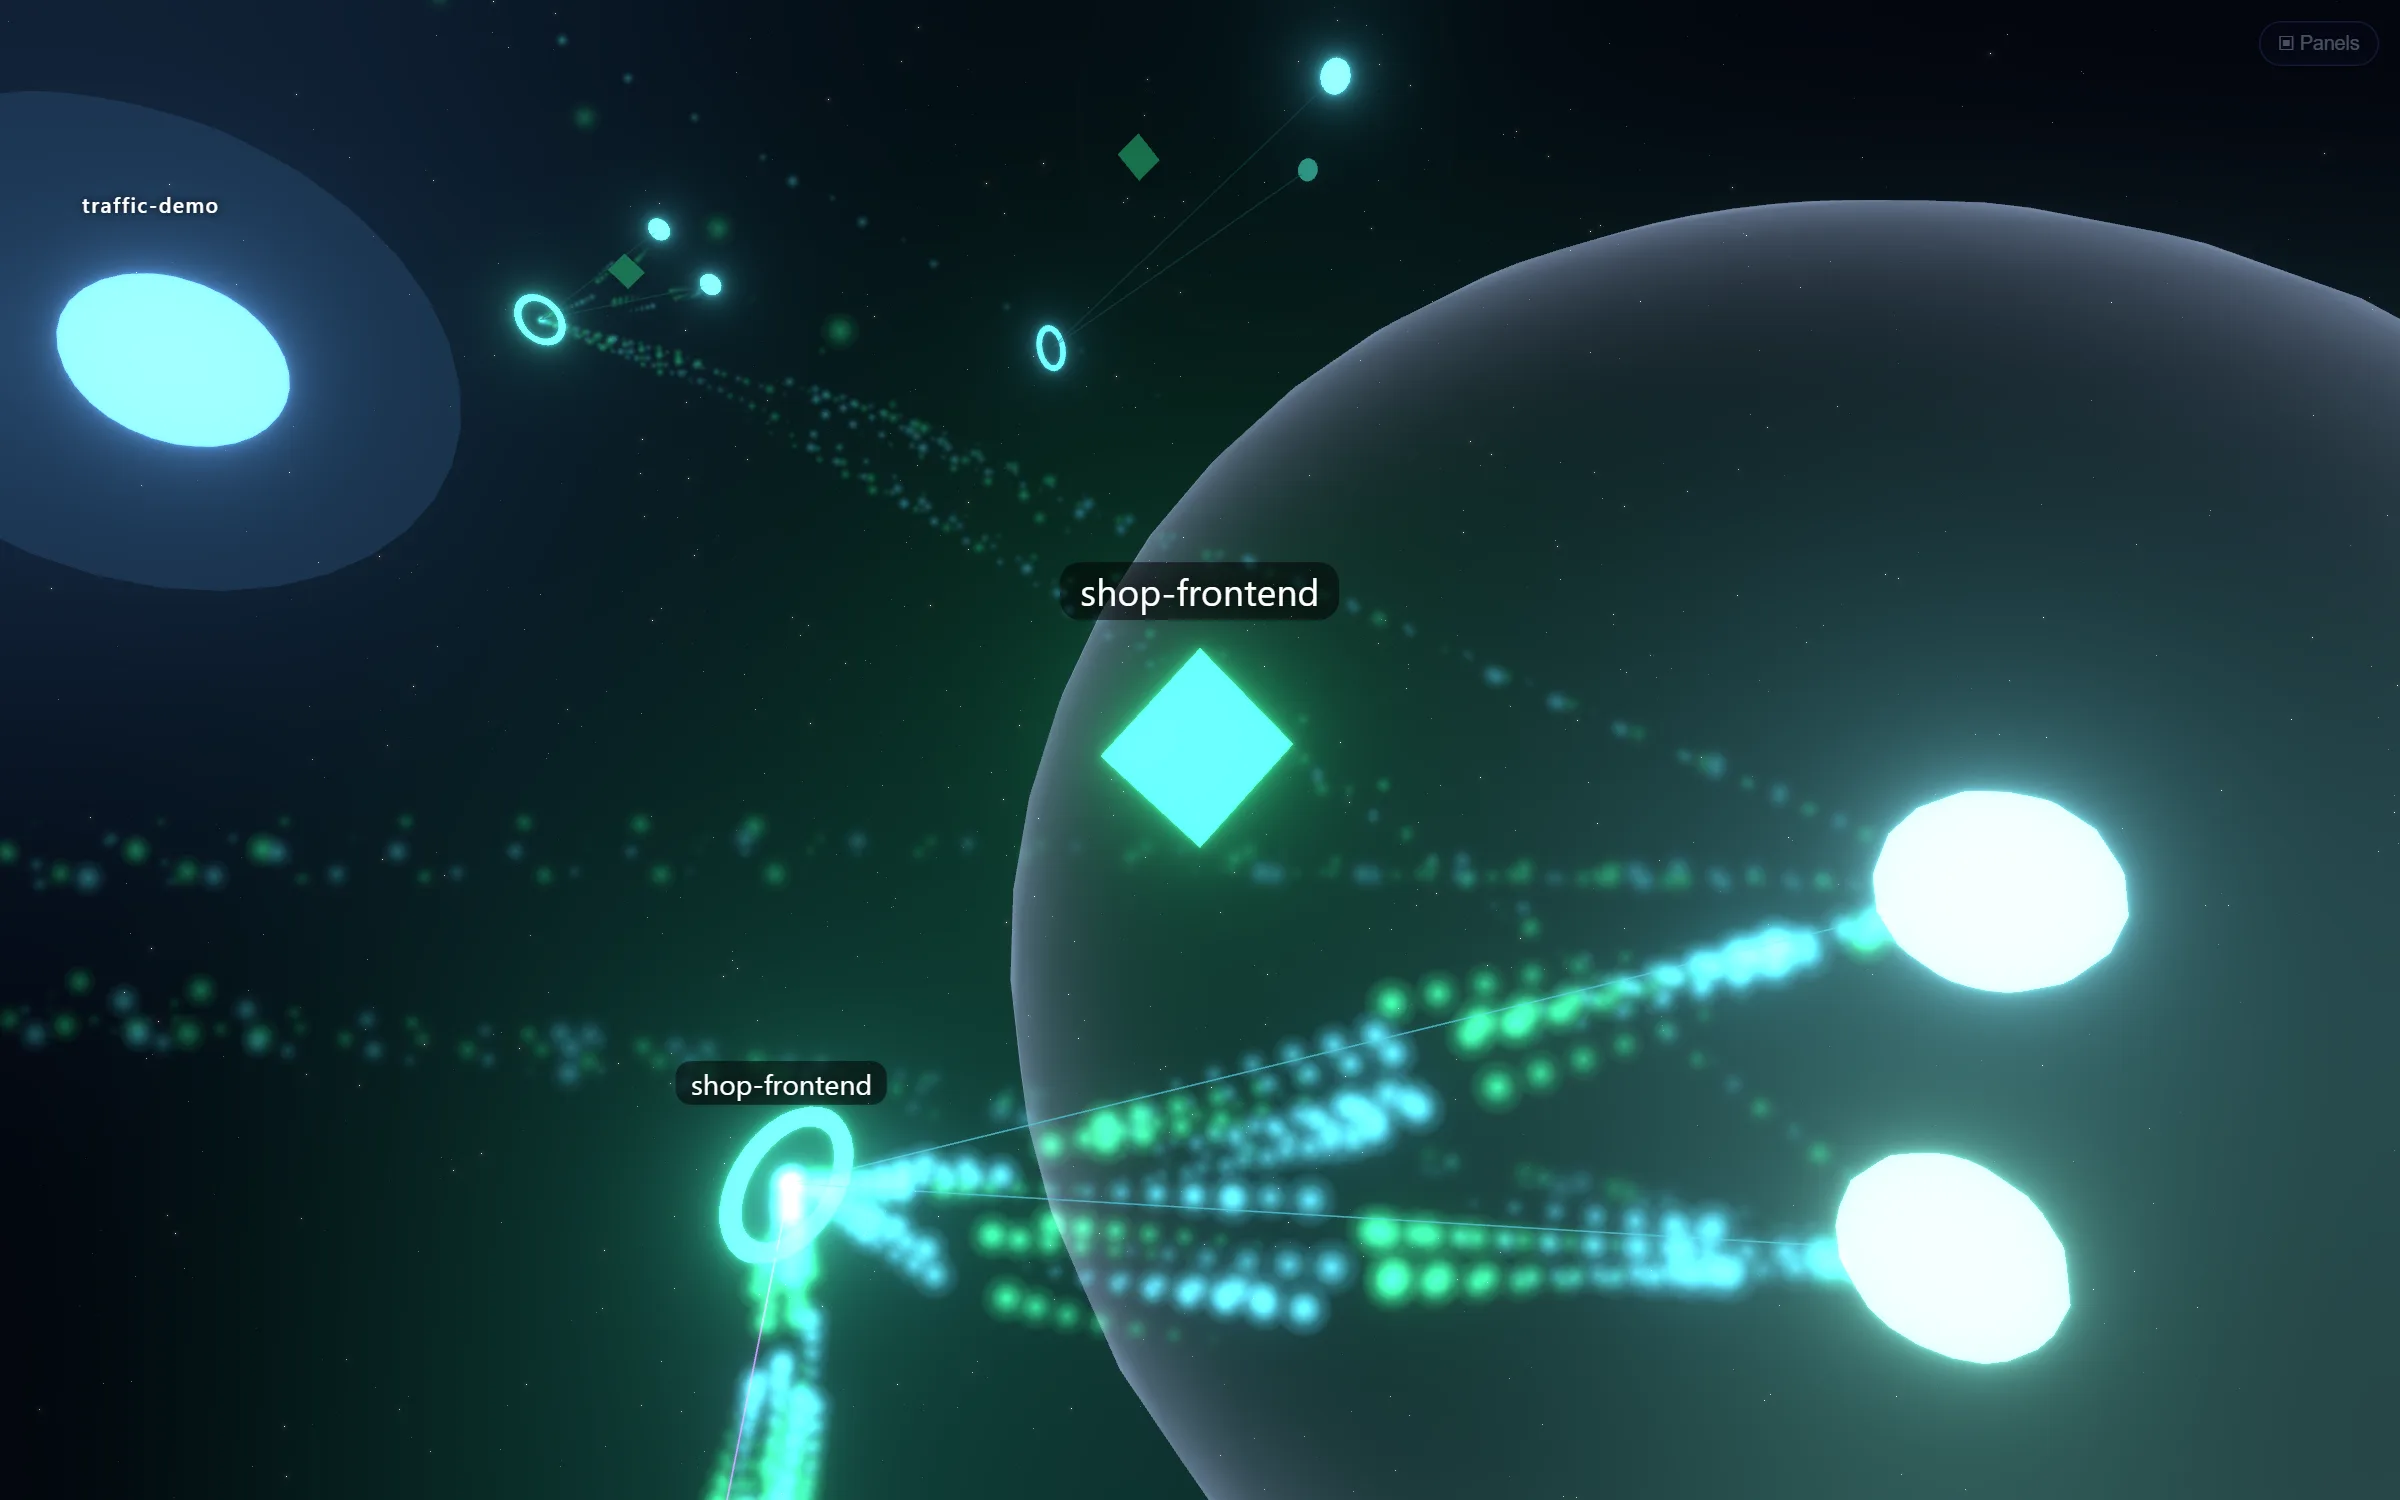
Requests as comets streaming into the shop-frontend deployment
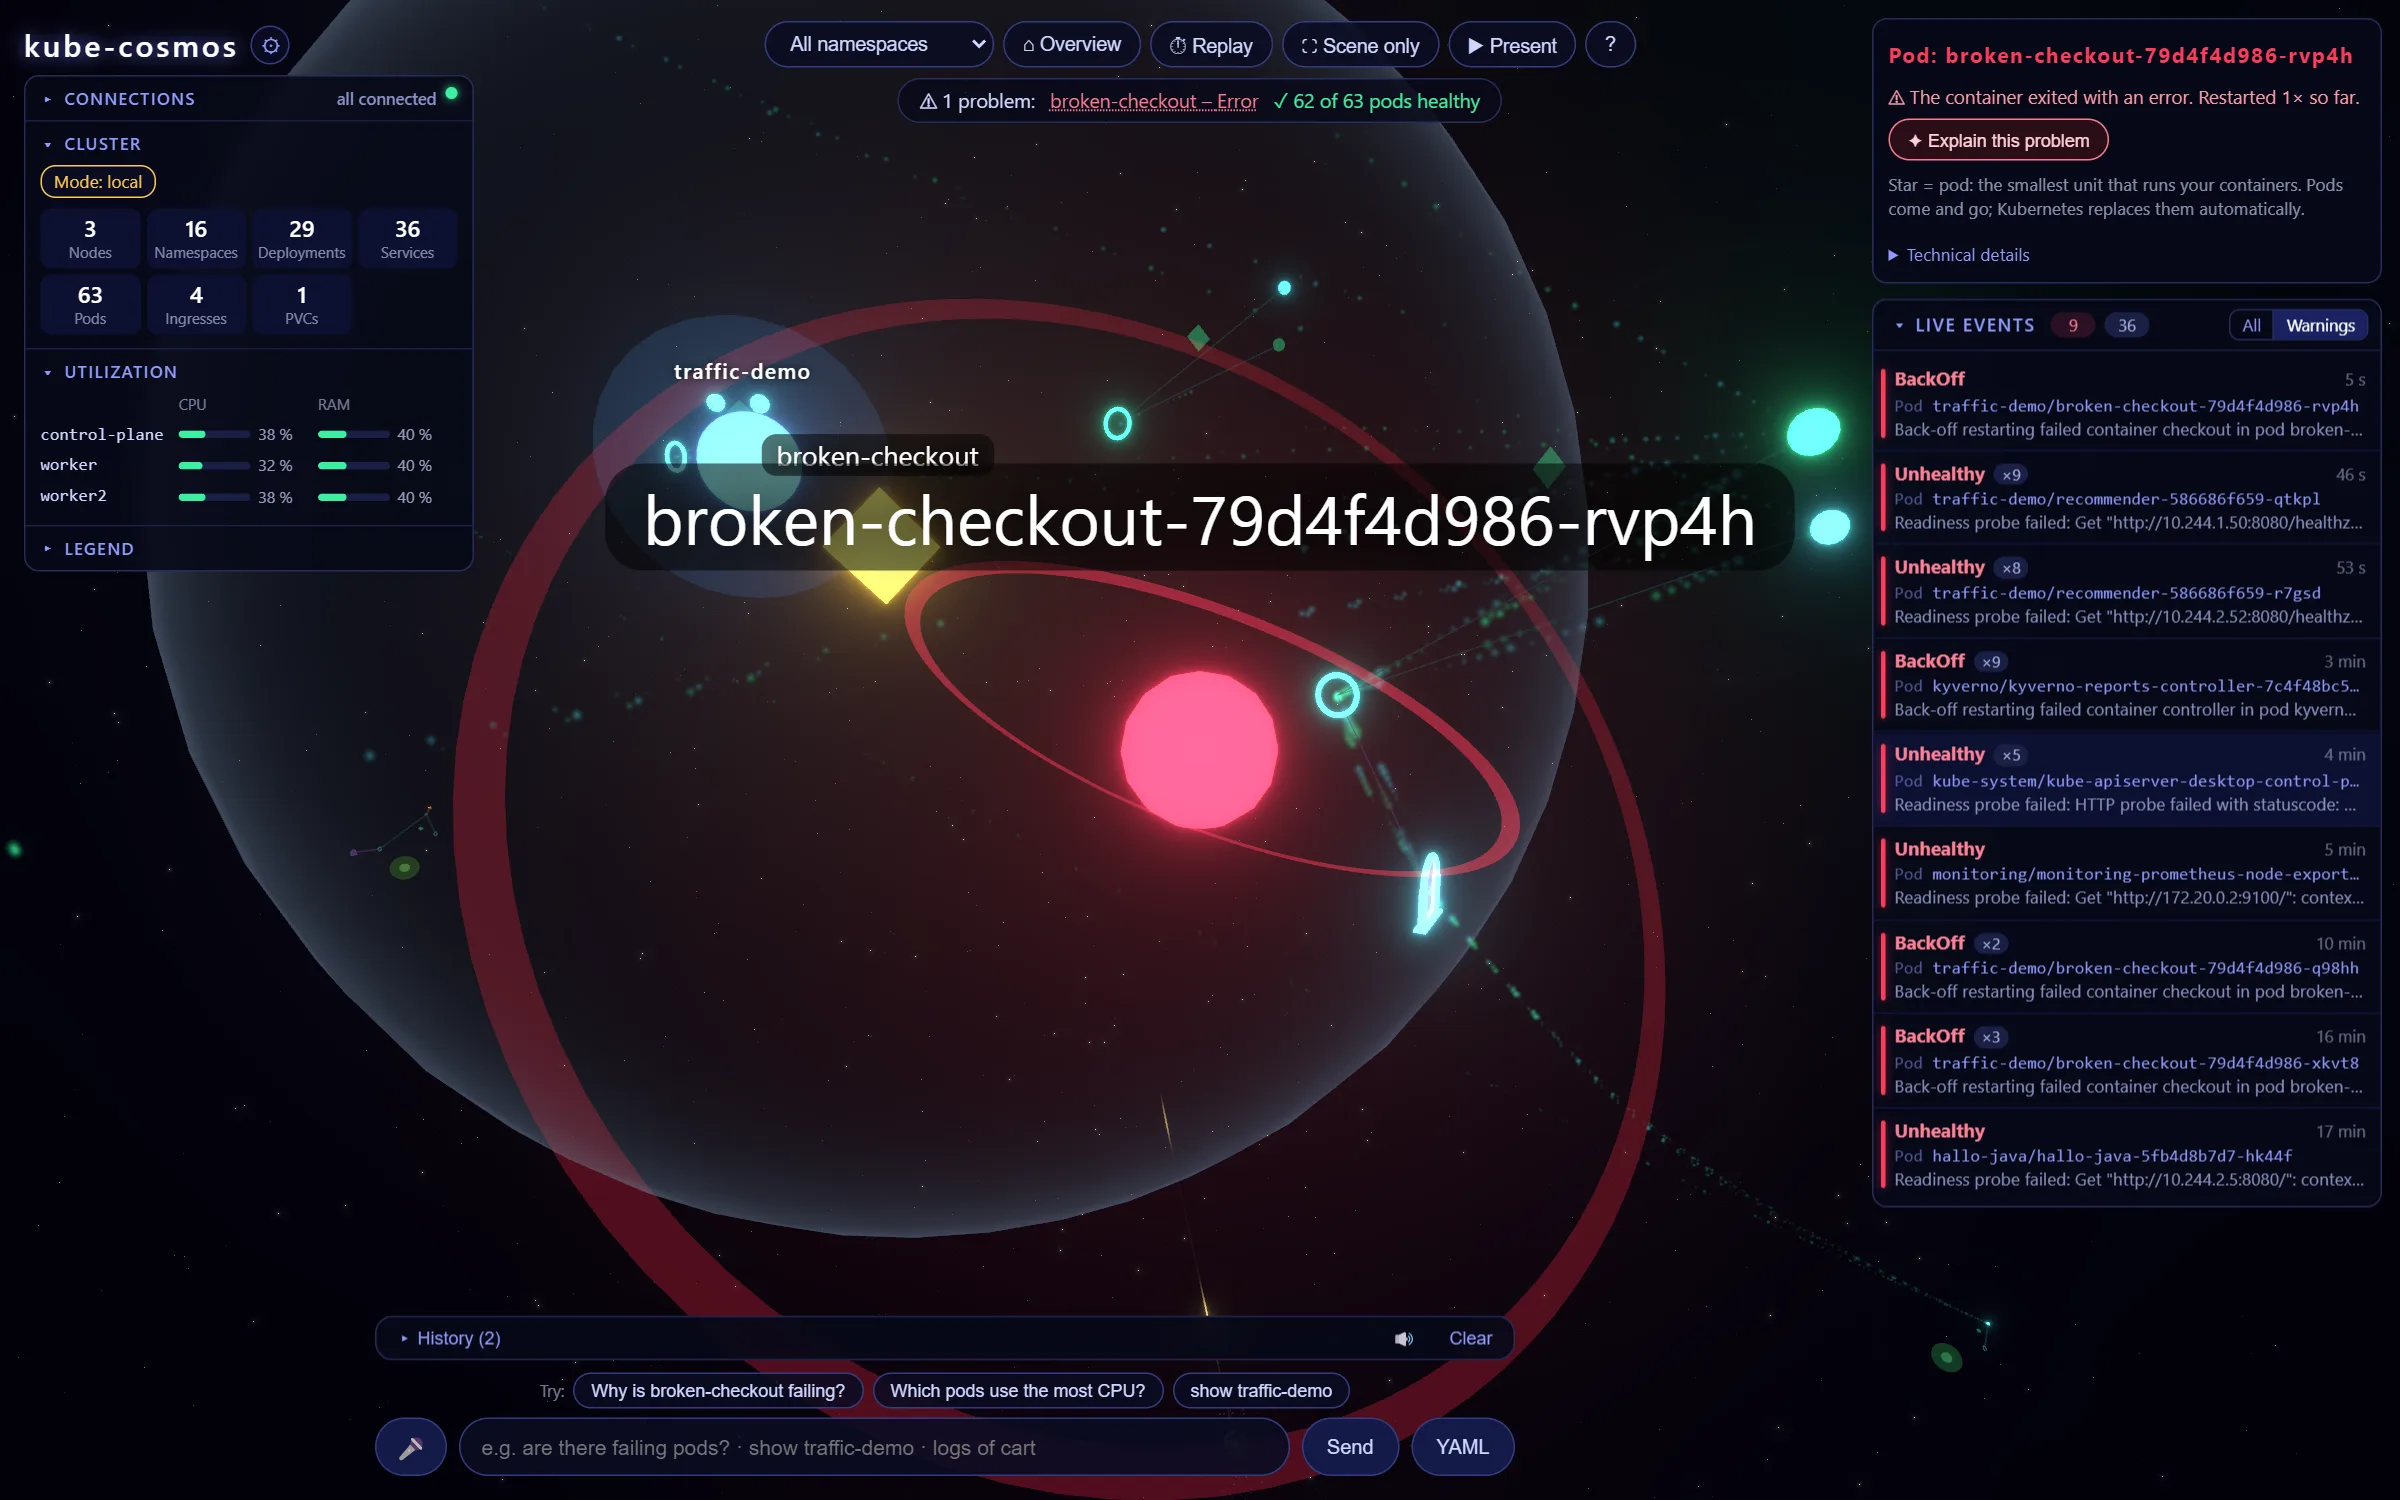
Problems you can’t miss

Red pulse, plain words

A health bar at the top always tells you how your cluster is doing. When something breaks, a red pulse marks it in the scene – one click flies you there, and the panel tells you in plain language what is wrong.

  • “The container keeps crashing right after start” instead of raw status codes
  • Live event feed with warnings first, grouped and clickable
  • Problems-only view dims everything healthy
A crash-looping pod pulsing red with the explanation panel open
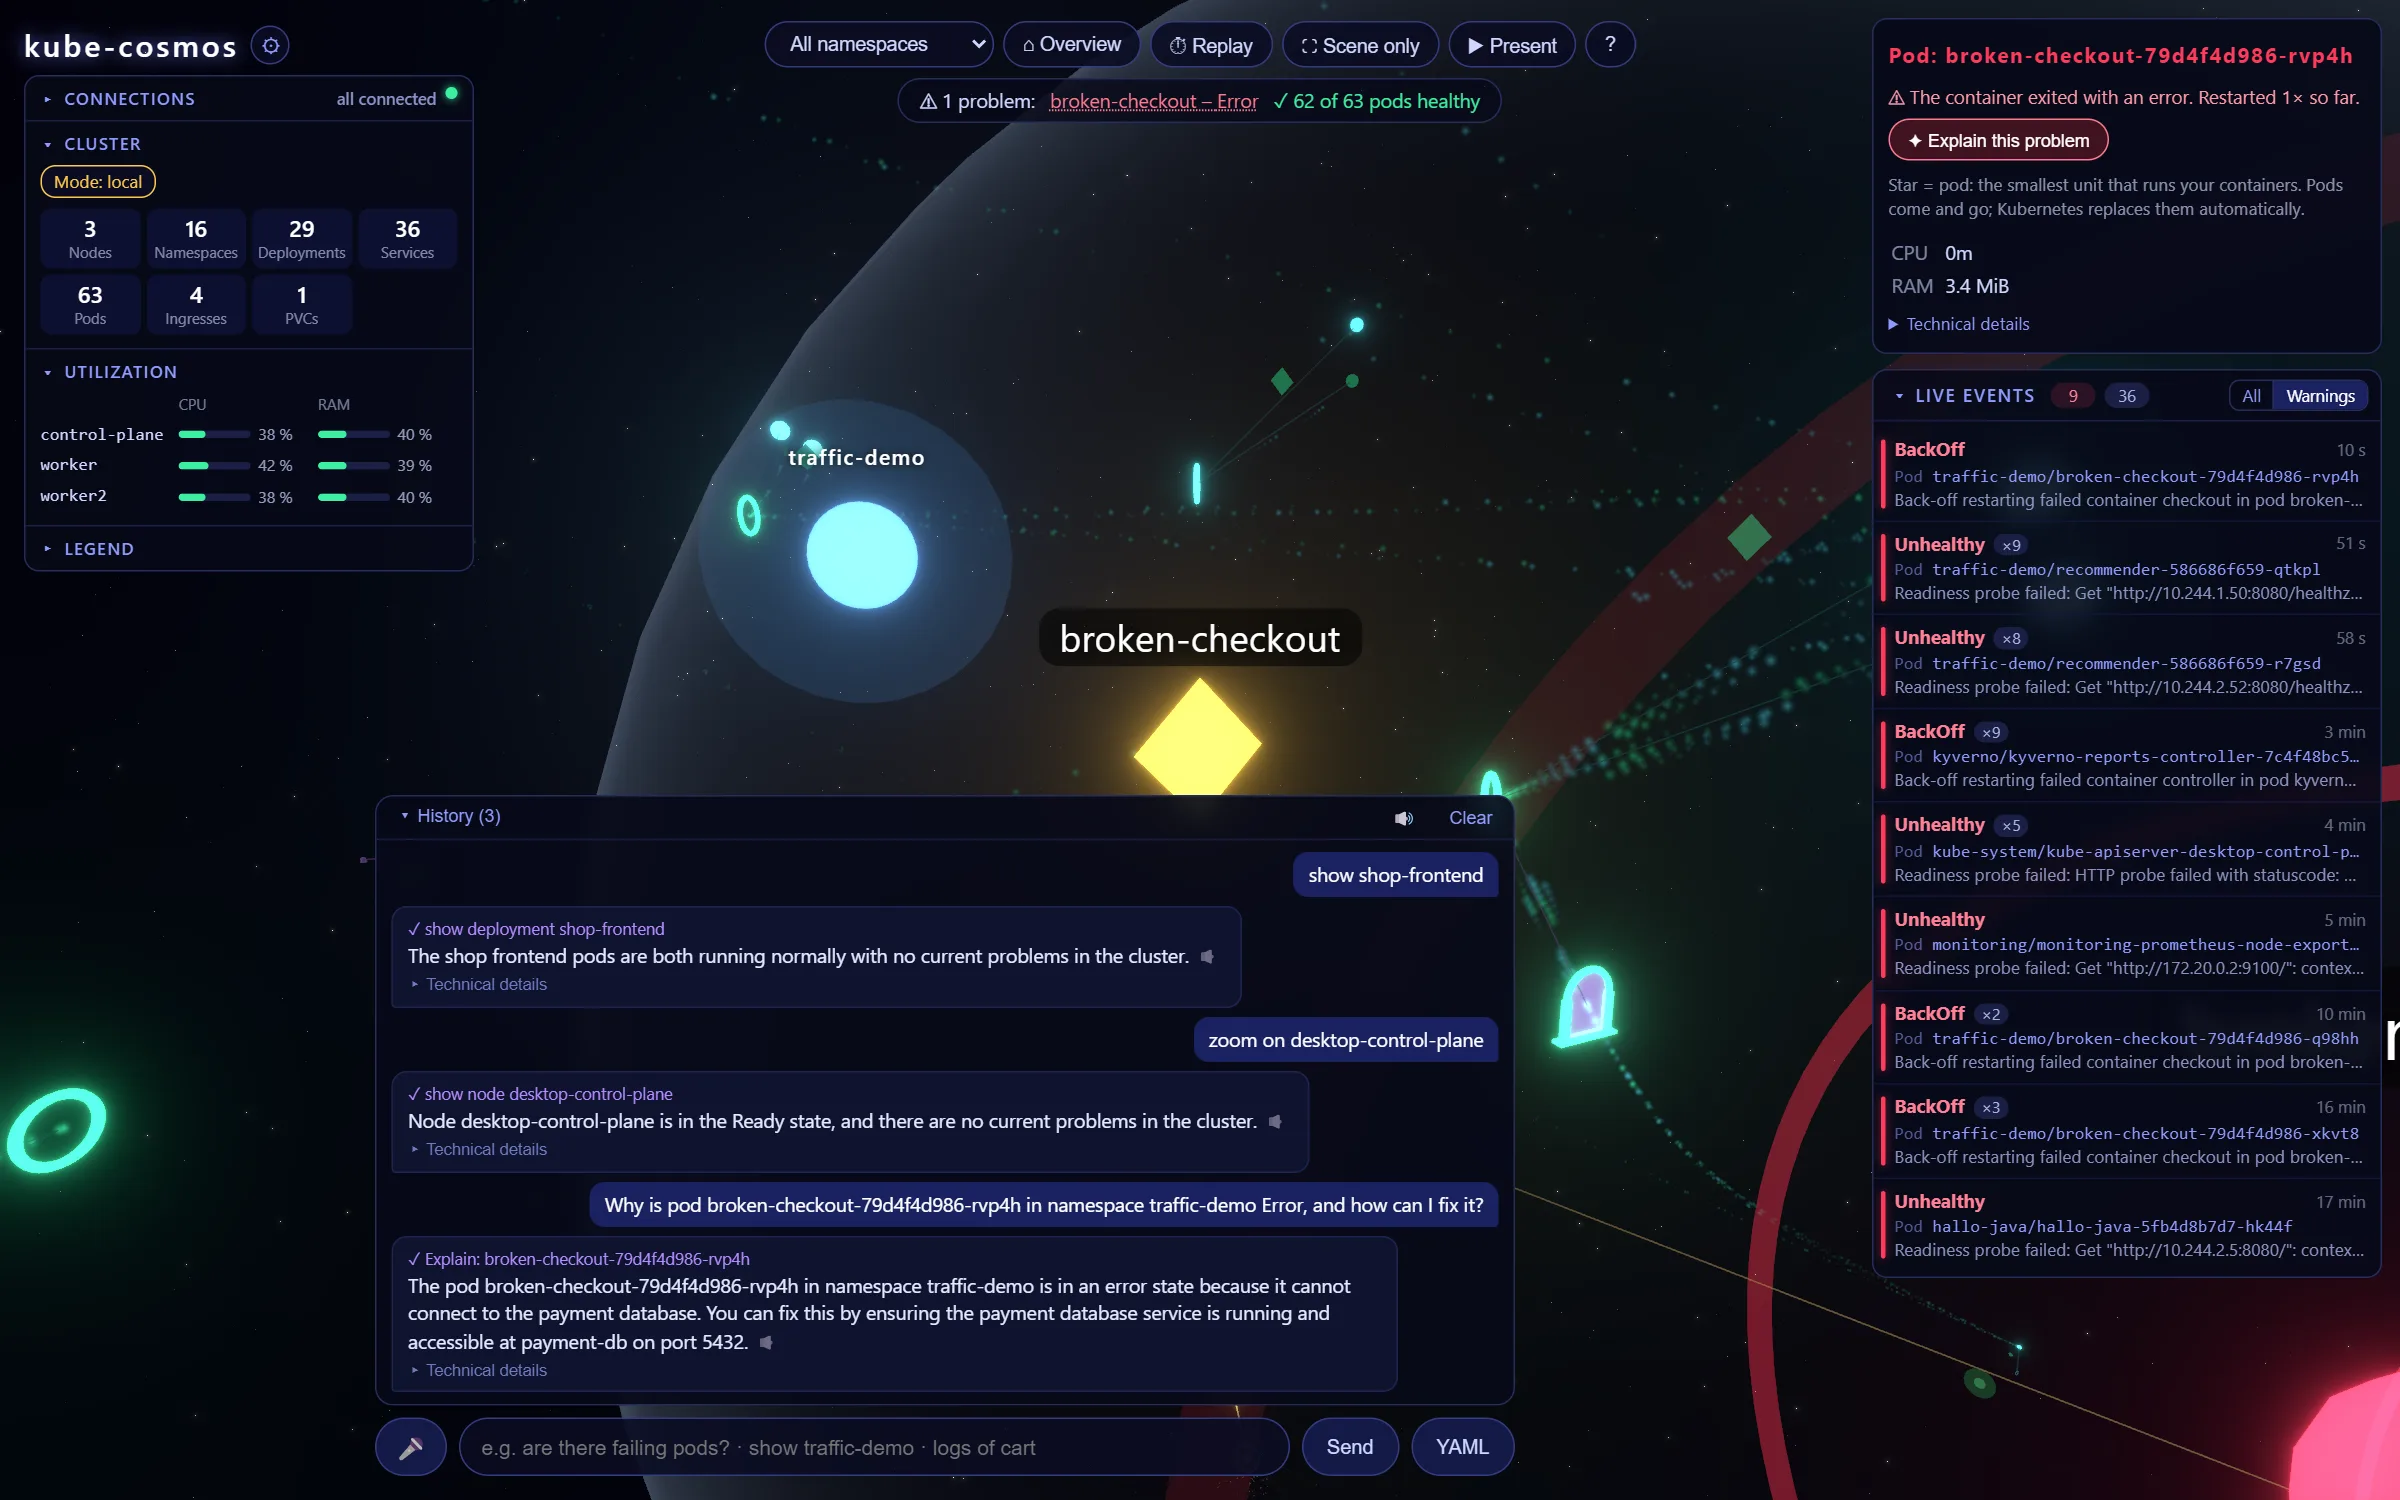
Ask in plain language

Ask your cluster, by text or voice

“Why is checkout failing?” – the built-in language model picks the right kubectl commands, runs the read-only ones instantly and answers in everyday words. Anything that would change your cluster waits for your confirmation.

  • Works with Gemini, any OpenAI-compatible API or a fully local Ollama
  • Navigate by sentence: “show traffic-demo”, “only monitoring”, “back”
  • Secrets are never read, shell syntax is never executed
The chat explaining why a pod is failing
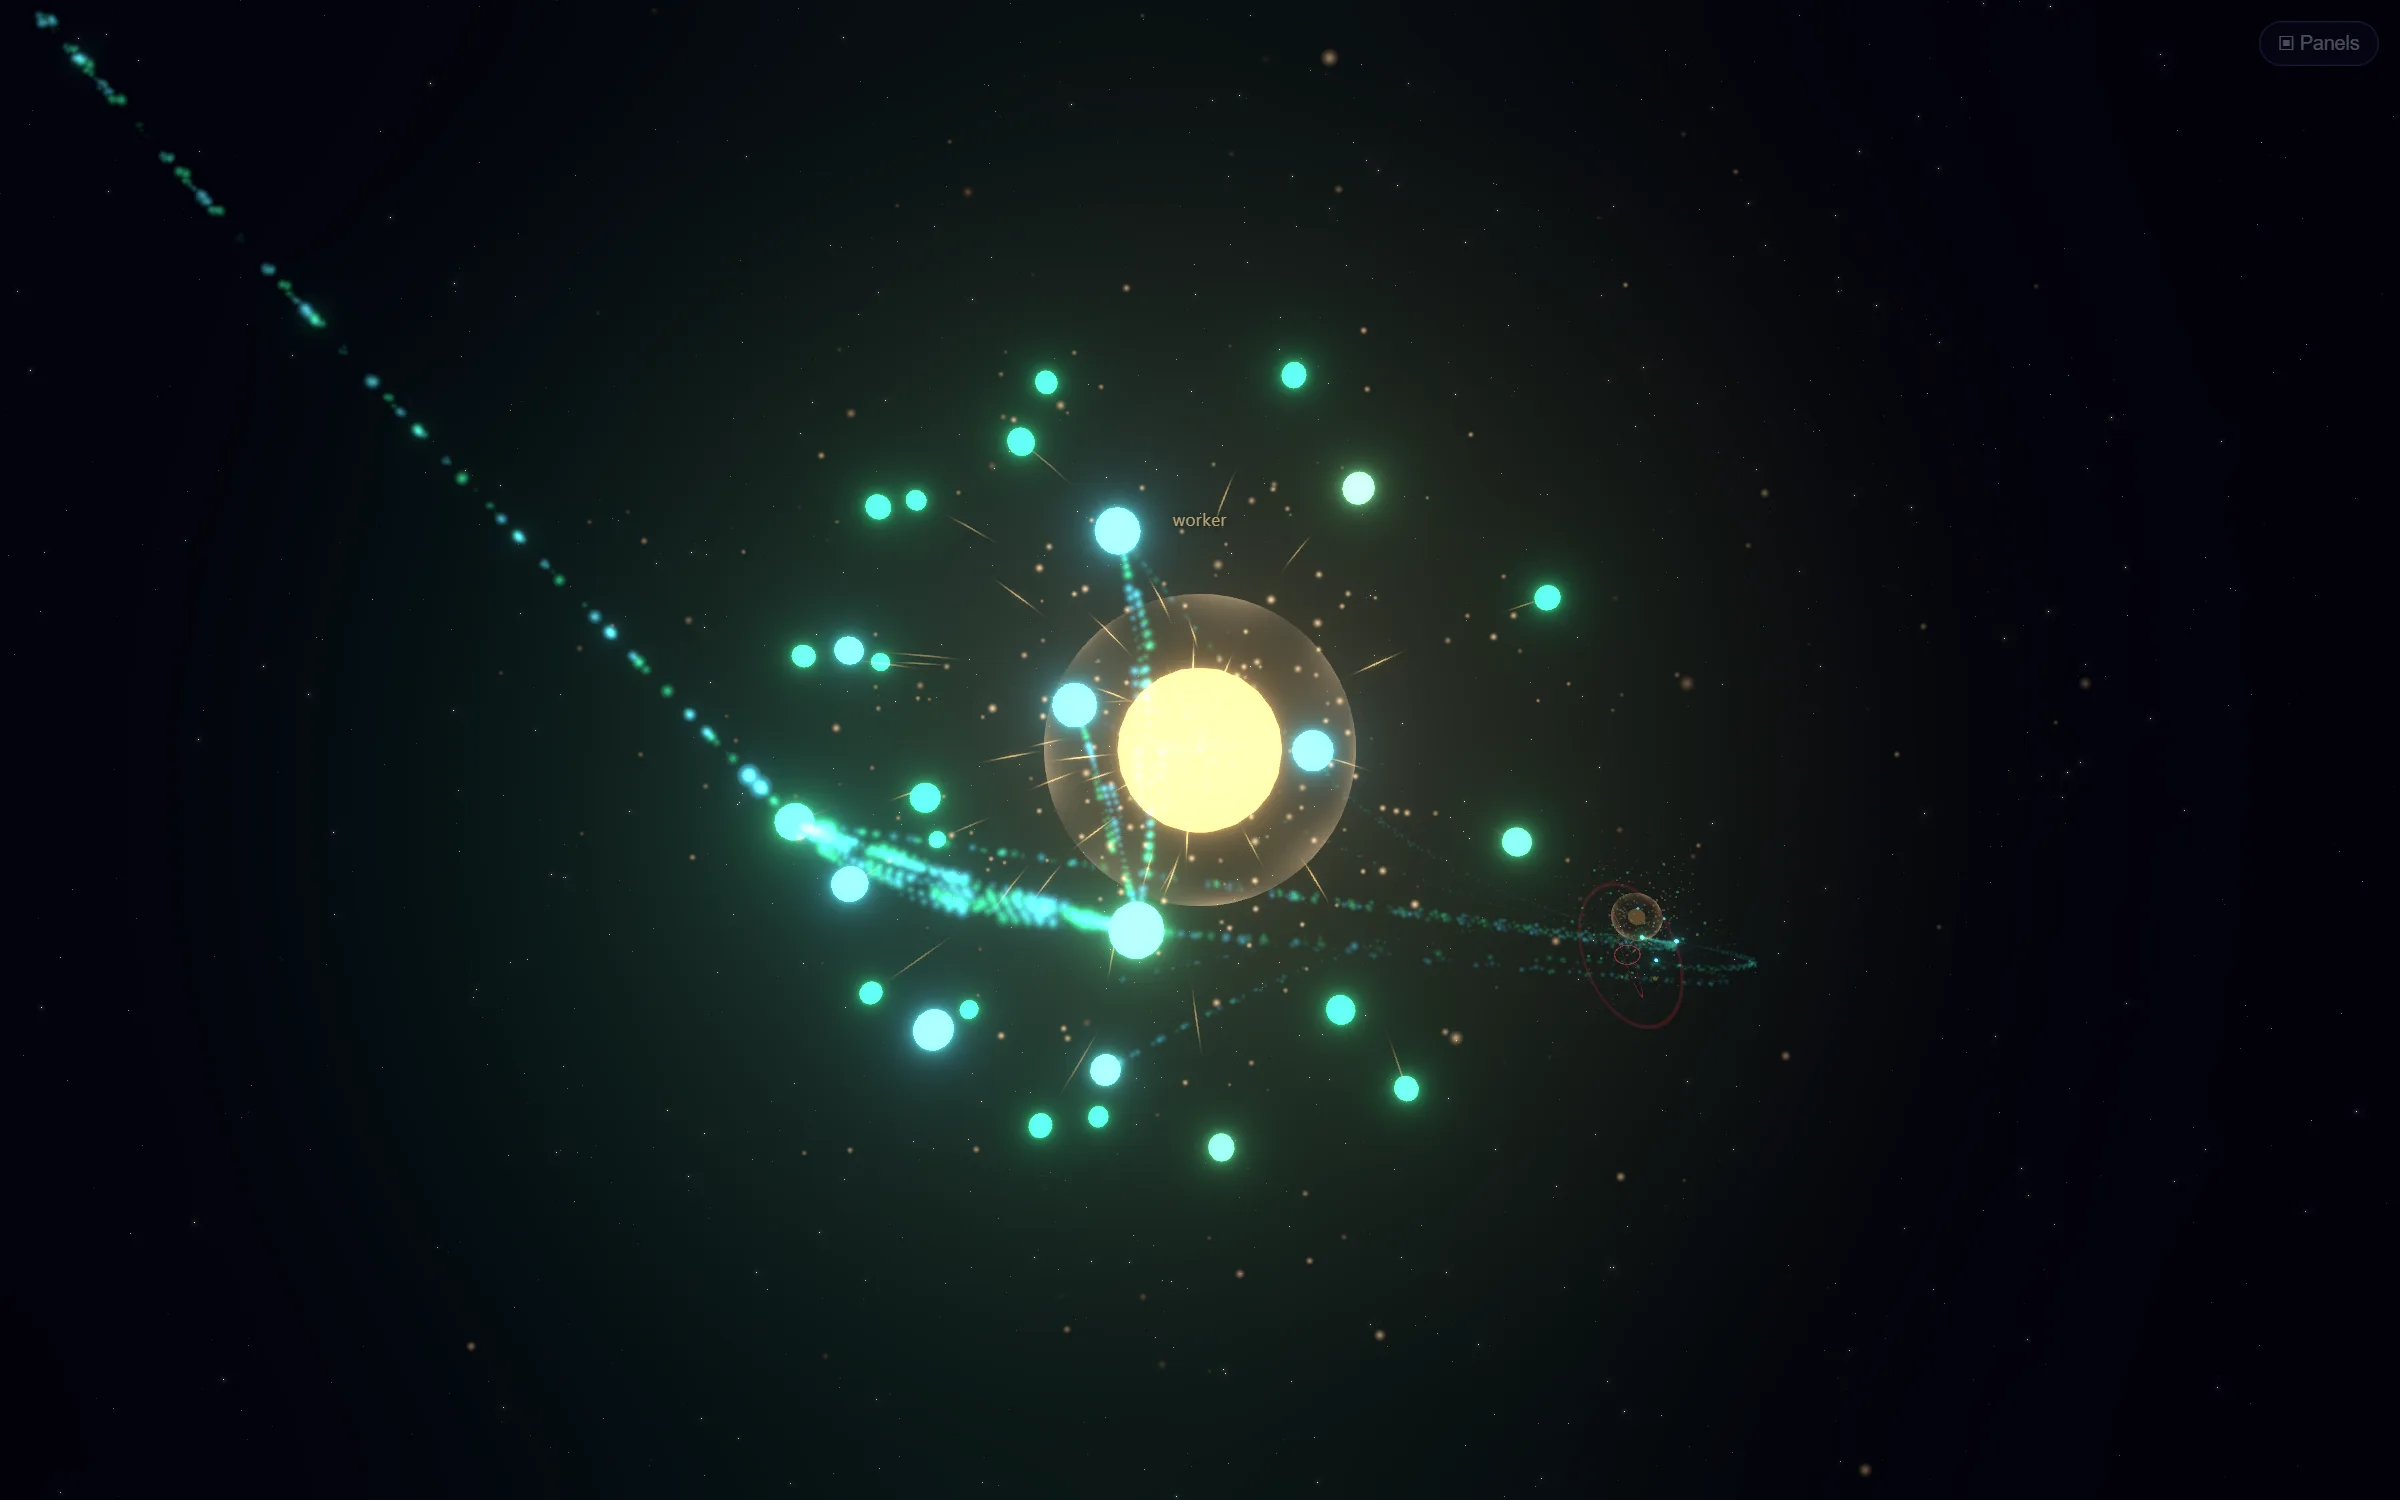
Nodes as suns

Feel the load of every machine

Your nodes are the suns of the universe. Their corona breathes with CPU load: calm and pale when idle, orange and turbulent under pressure, with solar flares when a machine runs hot. Switch to the node view and pods orbit the machine they run on.

  • CPU and memory per pod and node via Prometheus (optional)
  • Cordoned nodes get grey rings, failed nodes turn to embers
  • Only the relevant nodes stay visible when you pick a namespace
Node view: pods orbit a sun with an orange corona under CPU load
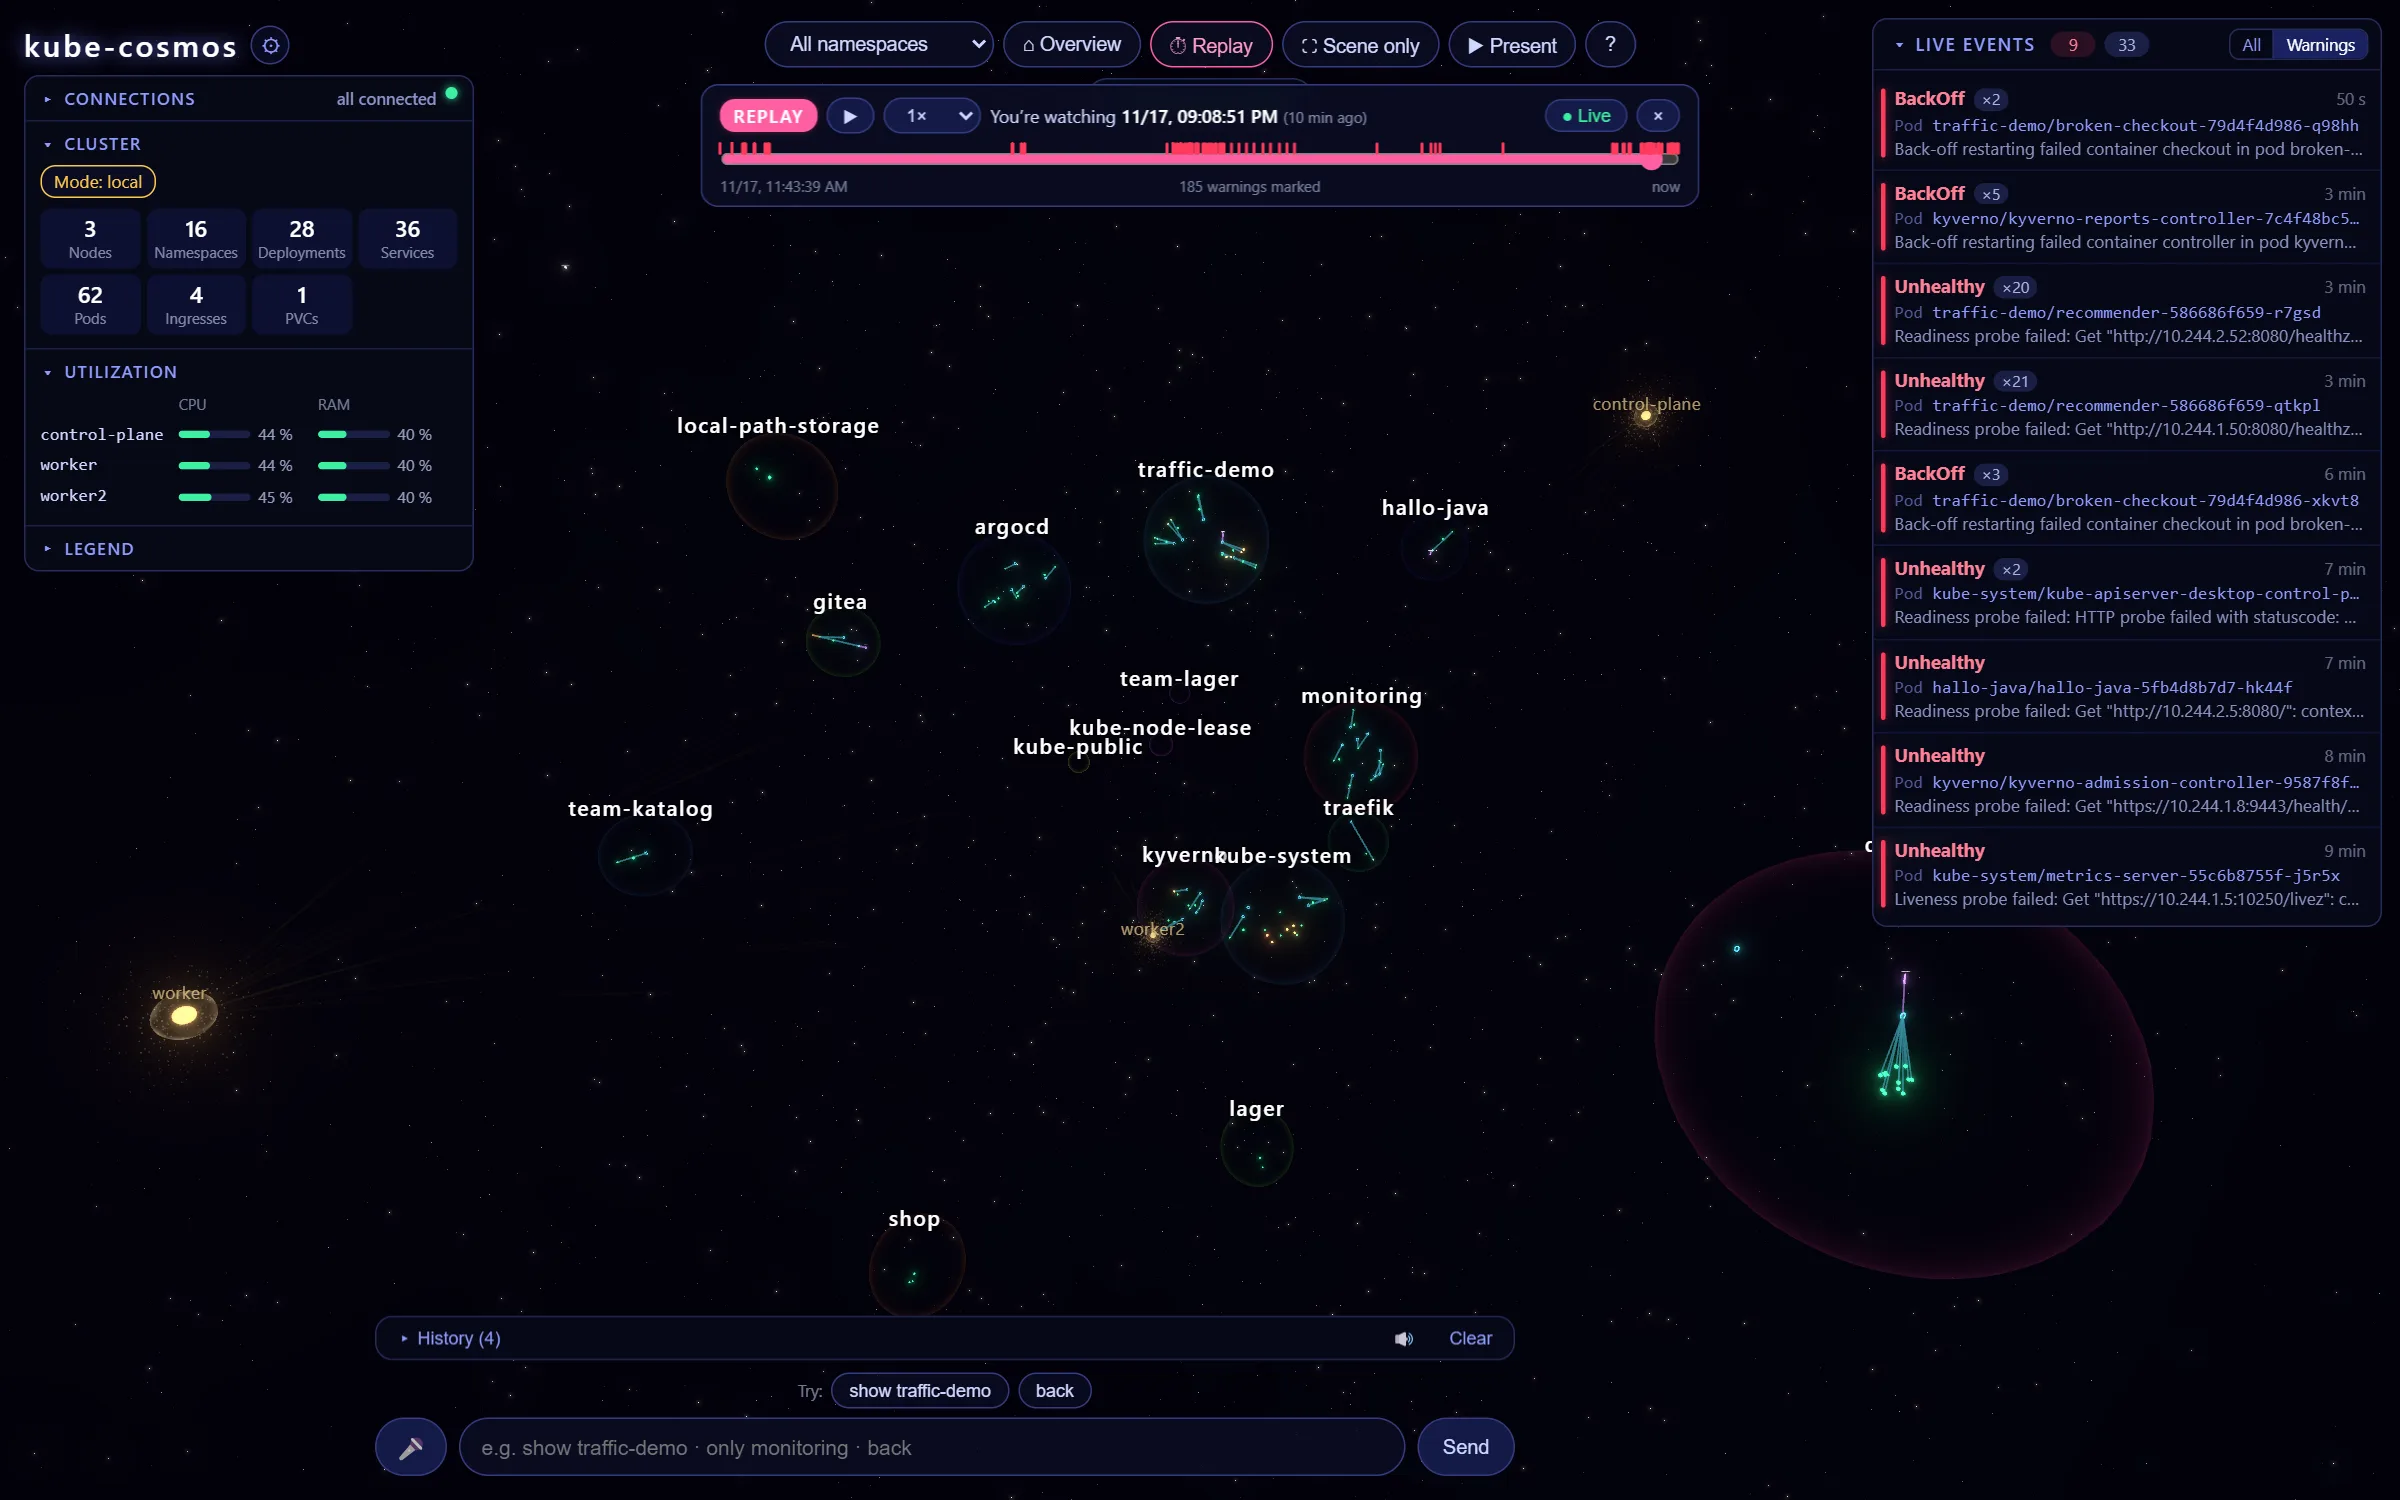
Time travel

Replay what happened

Every change, event, request and metric is recorded. Open the timeline, jump to any moment of the last 24 hours and watch it again – at 1×, 4×, 16× or 60× speed. Warnings are marked, so incidents tell their own story.

  • See the autoscaler scale up and down, after the fact
  • Hover a marker to see what happened, click to replay from 30 s before
  • Compressed hourly files, configurable retention
Replay timeline with warning markers
Presentation mode

Made for wall screens and meetings

One click and kube-cosmos takes everyone on a guided flight through the cluster: the big picture first, then every problem, then the largest namespaces – each with a calm caption. Perfect for the NOC screen, a stand-up or a management review.

  • All panels hidden, auto-rotating camera
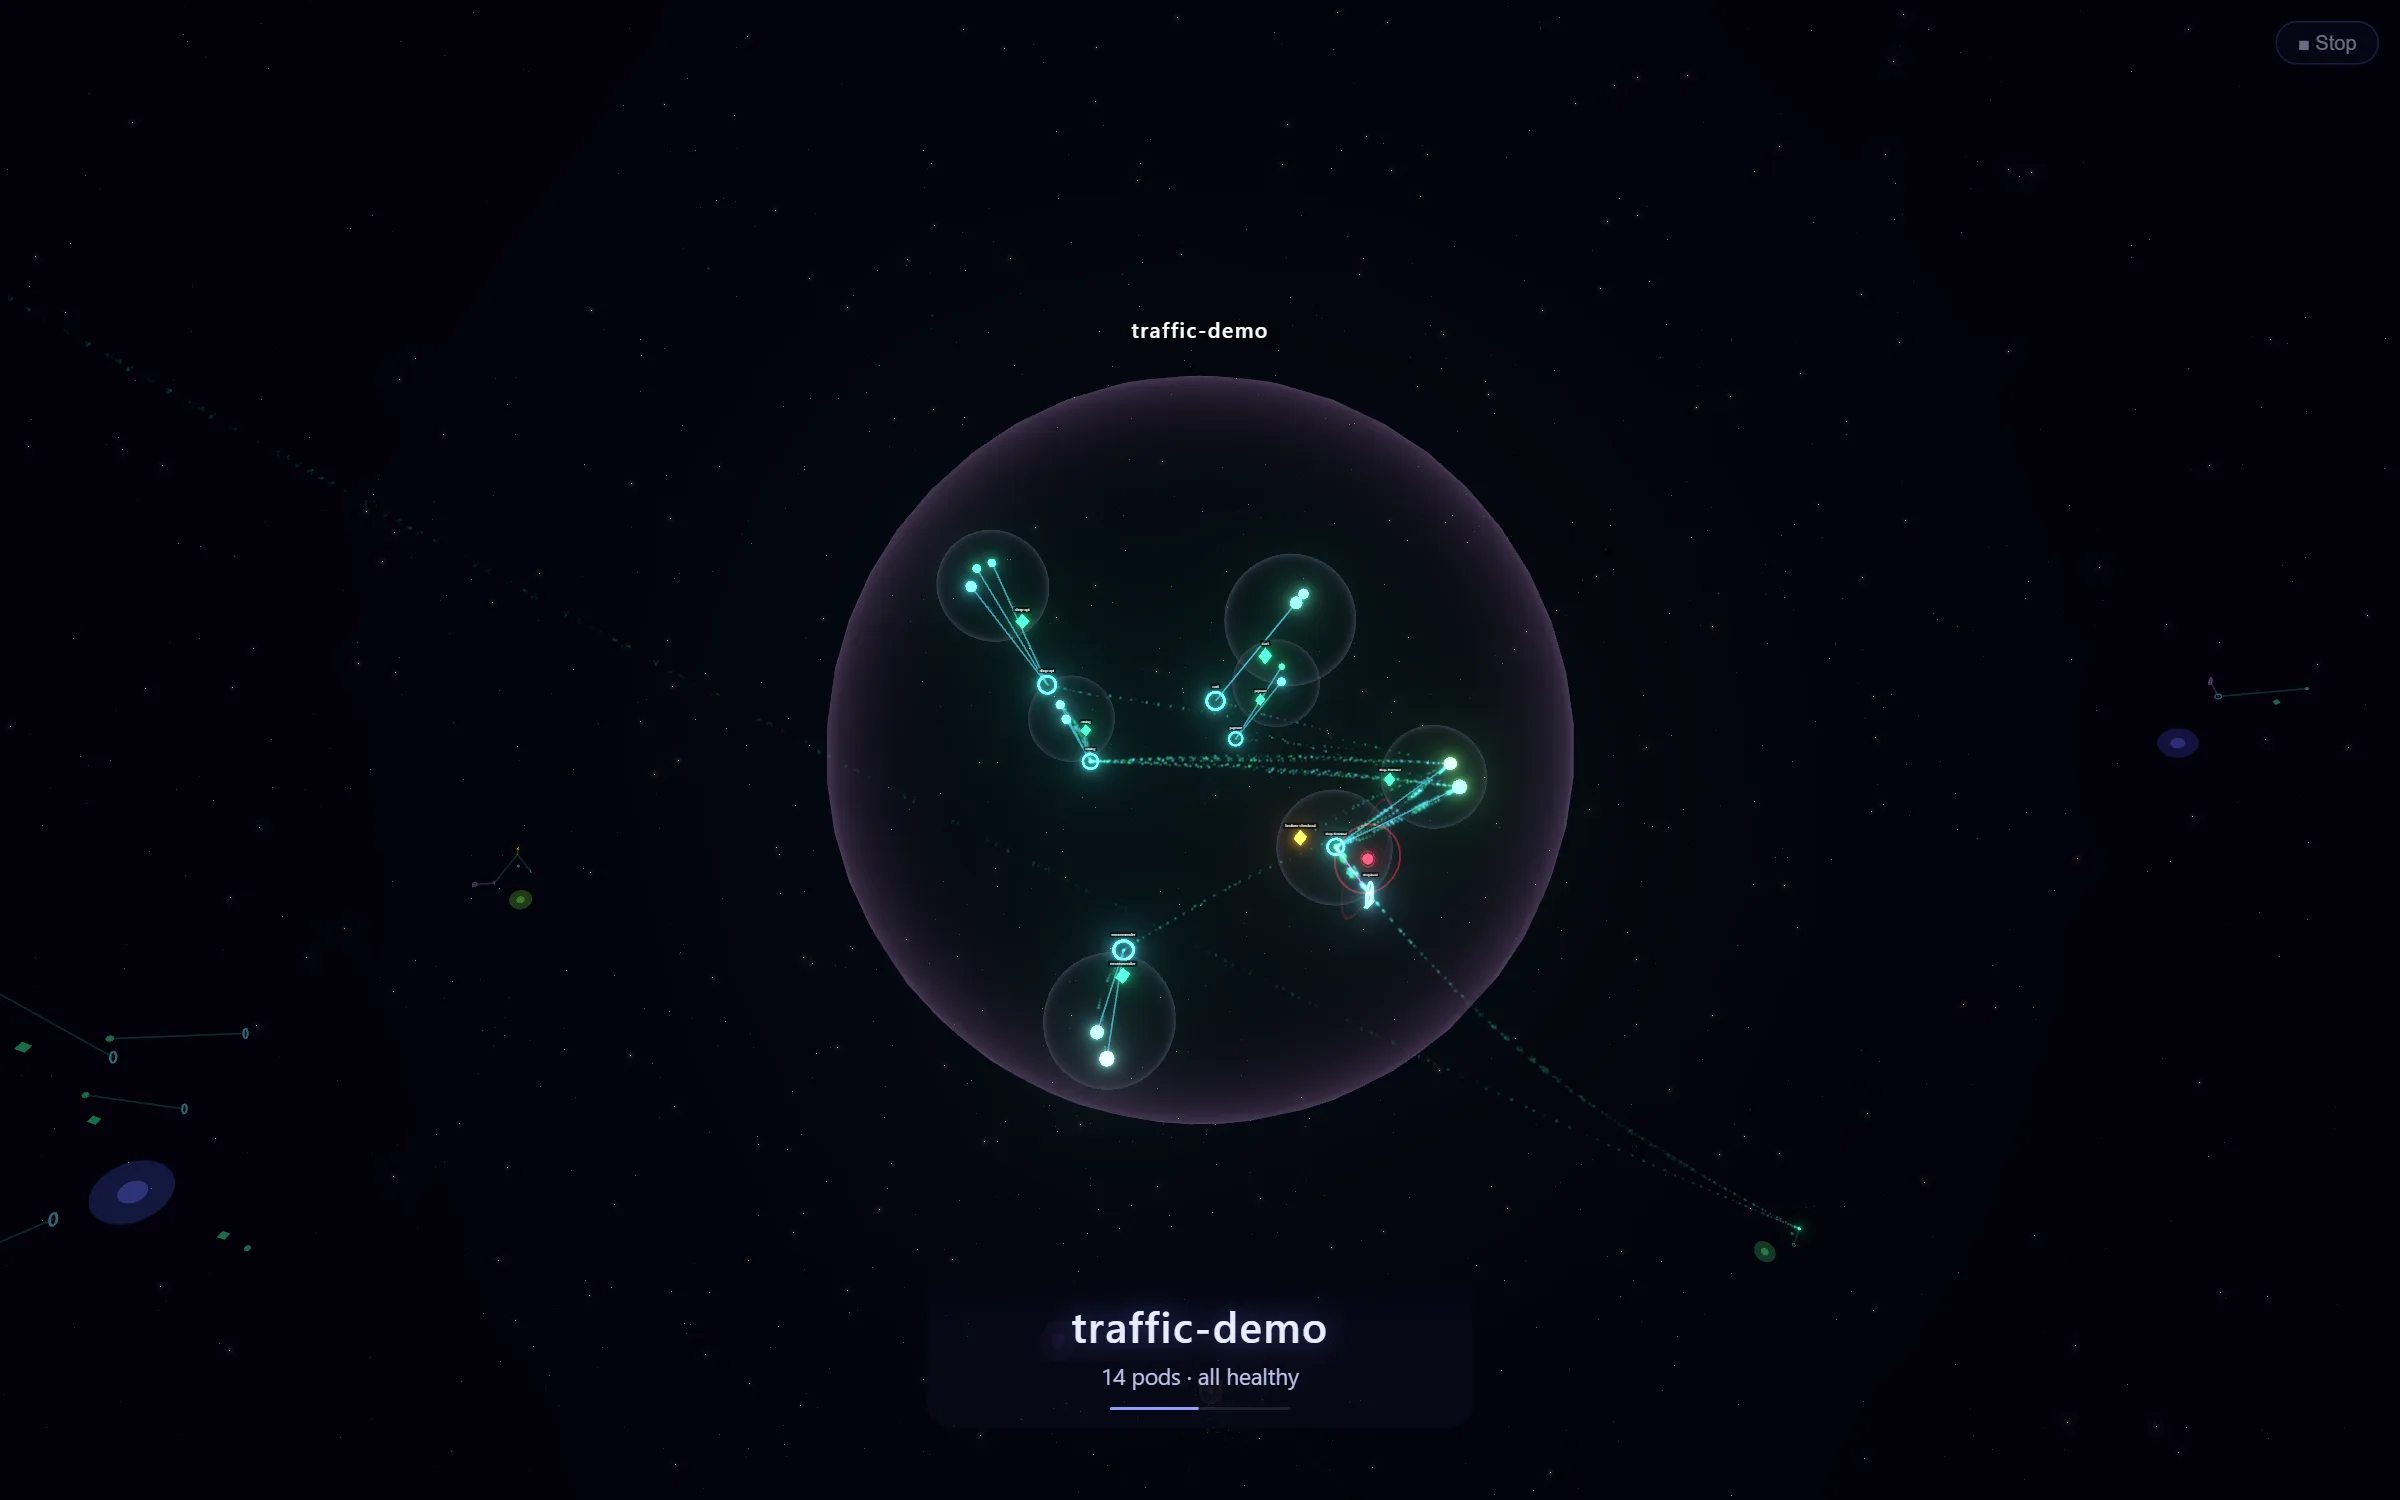
  • Captions in plain language: “14 pods · all healthy”
  • Guided first-run tour for newcomers
Presentation mode with a caption over a namespace galaxy

…and many more

📈
Autoscaling

HPA rings fill up as replicas grow – watch pods being born under load.

🛢️
Storage fill levels

PVC cylinders fill up like a gauge, warning colors near the limit.

🔥
Hot pods

With Prometheus, busy pods grow and glow, memory pressure pulses red.

🎙️
Voice control

Speak instead of type – answers can be read aloud.

🧭
Guided tour

A one-minute intro explains the picture with your own cluster.

🖱️
Hover cards

What is it, how is it doing – without a single click.

⚡
Context actions

Right-click for logs, describe, restart or scale – changes need confirmation.

📄
Apply YAML

Paste a manifest – checked for risky settings before anything runs.

🔎
Namespace zoom

Pick a namespace and the view focuses on it, with its own nodes.

✨
Event sparks

Kubernetes events flash as sparks right where they happen.

🎛️
Your view

Hulls or lines, glow, labels, starfield, auto-rotate, scene-only mode.

🌐
English & German

The whole UI – and the language model’s answers – in both languages.

Who it’s for

One picture, three audiences

Decision makers

“How healthy are we, really?”

See the state of your platform in seconds – without reading a single log line. Put it on a wall screen, or present it in the next review.

Learners & teams

“What is a pod, again?”

Kubernetes concepts become tangible: hover cards, plain-language explanations and a guided tour make kube-cosmos a great teaching tool.

Engineers & on-call

“What just happened?”

Follow traffic, spot the failing pod, ask why – and replay the incident afterwards. Read-only by default, kubectl when you need it.

Security & privacy

Safe by default

Built to be pointed at real clusters.

🔒
Read-only mode

In the cluster, kube-cosmos runs with a read-only ClusterRole: no writes, no secrets, access via port-forward only.

🏠
Local by default

Local mode binds to 127.0.0.1. Changing commands always need your explicit confirmation.

🧠
Your choice of language model

Use a cloud API or a fully local Ollama – then no cluster data ever leaves your machine. Or switch it off completely.

🛡️
Guard rails

Commands are validated: no shell syntax, no secret access, destructive operations are flagged, manifests are checked for privileged settings.

Get started

Running in a few minutes

All you need is Node.js and a cluster in your kubeconfig – Docker Desktop, kind, or any cloud cluster.

1
Clone

Get the code from GitHub.

git clone https://github.com/\
  sircorrectdude/kube-cosmos
cd kube-cosmos
2
Start the backend

Reads your cluster via kubeconfig.

cd backend
npm install
npm start   # MODE=readonly for foreign clusters
3
Open the universe

Then visit http://127.0.0.1:5173.

cd frontend
npm install
npm run dev

Want comets? Apply the traffic demo: kubectl apply -f demo/traffic-demo.yaml. Installing inside the cluster: see INSTALL.md.

FAQ

Questions, answered

Does kube-cosmos change anything in my cluster?

Not by itself. In read-only mode it cannot change anything at all. In local mode, changing commands are only proposed – they run after you confirm them.

Do I need a service mesh to see traffic?

No. kube-cosmos reads plain access logs (nginx, Traefik) from pods carrying the label kube-cosmos.io/access-log. A simulated traffic source is also available for demos.

Is a language model required?

No. Visualization, events, replay and navigation work without one. For questions in plain language you can use Gemini, any OpenAI-compatible API or a local Ollama.

How large can my cluster be?

kube-cosmos is developed against clusters with a few dozen namespaces and about a hundred pods; very large clusters haven’t been tested yet. The namespace filter and the problems-only view help you stay focused as your universe grows.

Where do the CPU and memory numbers come from?

Optionally from Prometheus (for example kube-prometheus-stack). Without it, kube-cosmos runs just fine – suns and pods simply don’t show load.

What does it cost?

Nothing. kube-cosmos is open source under the Apache-2.0 license.

Experience your cluster.
Understand it.

kube-cosmos is free and open source. Star it, try it, and tell us what your universe looks like.